Introduction
Crop Report for AGBM 170N: Blueberries in the U.S. Food System
1. Availability: Graph and describe the per-person availability of Blueberries.
The graph below displays a drastic increase in blueberry availability within the past 30 years, driven by high demand for fresh blueberries. As demand continued to increase, the U.S. started to heavily imported blueberries. Between 2000 and 2002, U.S. blueberry imports increased from 44 million pounds to 450 million pounds. From 2000-2021, blueberry availability increased by 574%, making blueberries one of the fastest growing berries and the second most consumed berry among Americans. (Blueberry:link)(USDA:link)

The USDA determines per capita availability by first calculating the total supply available for consumption, including imports, production, and beginning stocks. The USDA then subtracts blueberries used for exports, farm use, and industrial purposes. The remaining supply is divided by the U.S. population to calculate per capita availability. As of 2021, the USDA-ERS reported 2.3 pounds of blueberries per person, an all-time high. Overall, the graph shows an increase in blueberry availability, with the steepest growth occurring between 2007-2021. This trend supports the growing demand for fresh blueberries. (USDA:link)
2. U.S. Graph and describe the U.S. production of blueberries.
Since 2010, the U.S. blueberry production season expanded from strictly summer into spring and early fall. Through conventional plant breeding, scientists were able to develop blueberry cultivars to begin harvesting earlier. This allowed more states to begin producing berries and extending blueberry availability. In specific, Washington now produces approximately 24% of the U.S. cultivated blueberries. Additionally, states such as Washington, Michigan, and Oregon are able to ship blueberries into October through controlled-atmosphere storage, preserving blueberries after harvest. Because the U.S. cannot produce blueberries year-round, imports provide a guaranteed year-round supply of blueberries for U.S. citizens. USDA: (link)(link)
According to the USDA-ERS, blueberry production peaked in 2019 at 372 million pounds produced in the U.S. In 2020, a sharp decline in production occurred due to the COVID-19 pandemic. The pandemic affected travel restrictions for migrant workers who play a vital role in blueberry farming and production, leading to a lower number of blueberries produced. Since then, blueberry production is steadily increasing and in 2021, the U.S. produced 354 million pounds of blueberries. (link)(link)
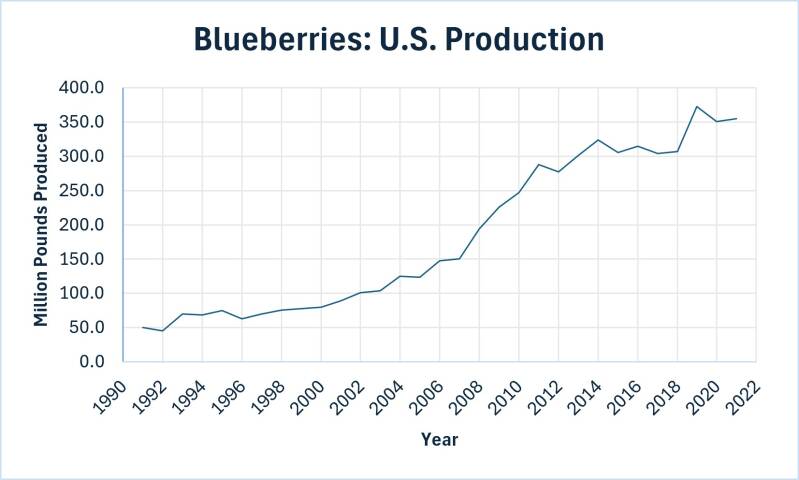
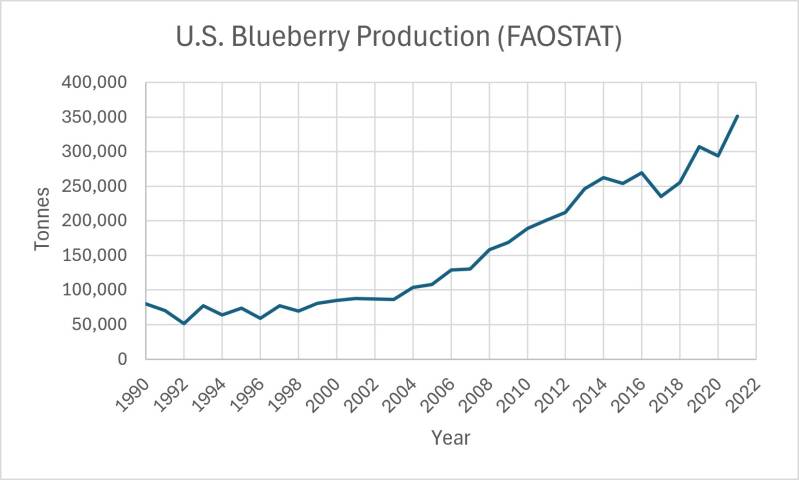
Pictured below is a graph featuring U.S. blueberry production from FAOSTAT. The FAOSTAT graph differs from the USDA graph in year of peak production and overall number of blueberries produced. The USDA claims that the peak production of blueberries was in 2019, while FAOSTAT displays a sudden decline in blueberry production during that time period. Additionally, the USDA graphs display a maximum production at 374 million pounds of blueberries whereas the FAOSTAT shows a maximum production at around 350,000 tonnes, or 751 million pounds of blueberries. The inconsistent data from USDA and FAOSTAT could be a due to the definition of "production". FAOSTAT counts all harvested blueberries, including damaged and rotten berries. In contrast, the USDA has a specific way of estimating the overall amount of blueberries strictly in the United States. Overall, the differences in data are due to blueberries "produced". The USDA does not count rotten blueberries while FAOSTAT does. (link)
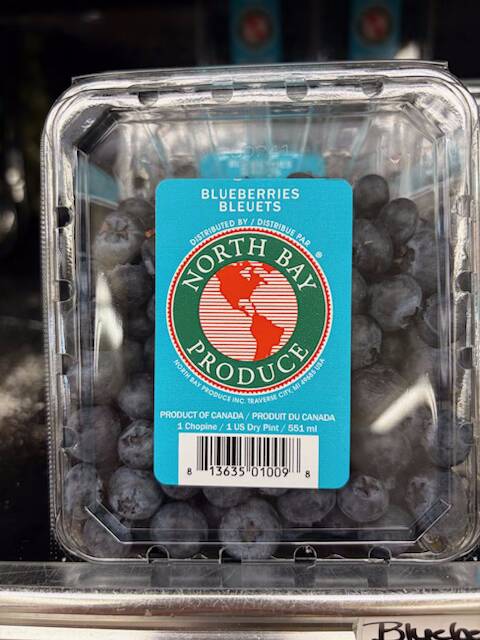
3. Supermarket presence: Blueberries purchased from Goodmans Foodliner in Curwensville, PA
4. Written Detailed Story: Magazine Articles About Blueberries
Product of Canada
Displayed in the picture to the left, the "Product of Canada" stamp is clearly visible on the lower left hand side of the container. The USDA requires fruits and vegetables to be properly labeled with country of origin.
In 2025 roughly 720 million pounds of blueberries were imported from Canada into the U.S. Additionally, approximately 99% of cultivated blueberries are imported through the months of January to March. As shipment prices increase, retail price increases as well. Therefore, blueberries are most expensive during the months of January to March in the U.S. (link)
Canada is the world's second largest blueberry producer due to the climate. Cold winters allow for maximum restoration within the blueberry plant leading to higher blueberry yield. Additionally, Canadas soil composition is generally acidic, which is ideal for blueberry production. (link)
Article 1: Science Direct
Everyone should be eating blueberries because they are a superfood. The bioactive compounds in blueberries contribute to anti-inflammatory receptors, cardiovascular system, and anti-cancer benefits. Additionally, blueberry by-products such as seeds and peels can be used for natural dyes and pharmaceuticals. This emphasizes how blueberries are a multi-use fruit and beneficial to multiple industries. Science Direct also explains the ability to easily sustain organic blueberry farms. One study showed that organic blueberry farms had the highest yield with lowest production cost in comparison to conventional blueberry farming. Due to agroecological principles, organic blueberry farmers capitalized on healthy soil to manage microbial activity. This method also relies on the use of cover crops and biological pests to control weeds and diseases transmitted through both soil and insects. Organic blueberry farming is less harmful to the environment than conventional blueberry farming, emphasizing the overall hierarchy of organic blueberry farming. (link)
Article 2: Blueberry.org
Blueberries have natural medicinal effects. In specific, blueberries are known to be a natural glucose regulator for individuals with diabetes. The high fiber content of blueberries slows digestion to support stable sugar levels throughout the day. Blueberries also contain anthocyanins which improve cholesterol, blood sugar, and blood pressure. Lastly, the sweetness of blueberries allows those with diabetes to satisfy sweetness cravings while still supporting overall health. (link)
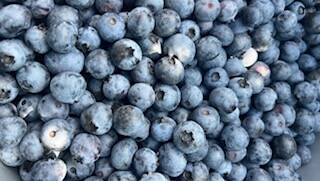
creators image
5. Consumer Health and Social Concerns:
Topic
Title
Source

6. Carbon Footprint: Blueberries
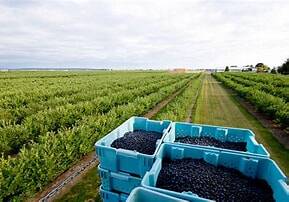
The carbon footprint of a blueberry is relatively high compared to other berries. This is due to energy usage, plastic packaging, and mechanized farming. A blueberry plant can take anywhere from 2-4 years to mature and produce fruit. Therefore, pesticides, irrigation, and mechanical farming equipment are used on the bushes for an extended period of time before the bush is able to produce fruit. Furthermore, blueberries have the greatest impact on carbon footprint during the harvesting, processing, and packaging. The emissions created by plastic packages produce the most amount of carbon footprint. Overall, one pound of blueberries produces one pound of carbon emissions. (link)
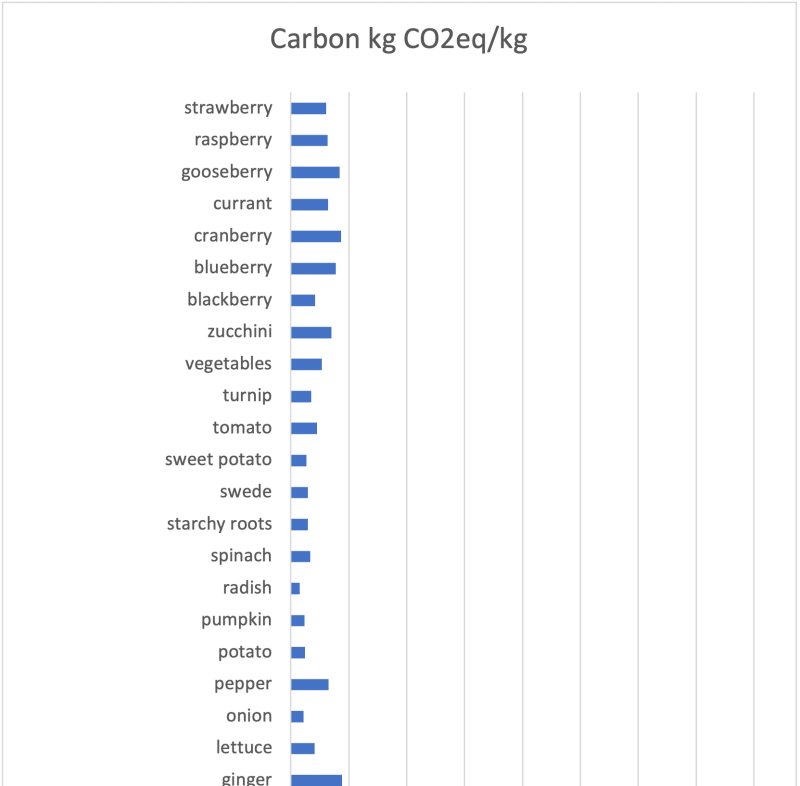
Graph (link)
The evolution of a modern superfood
Blueberries are the superfood of a lifetime.