
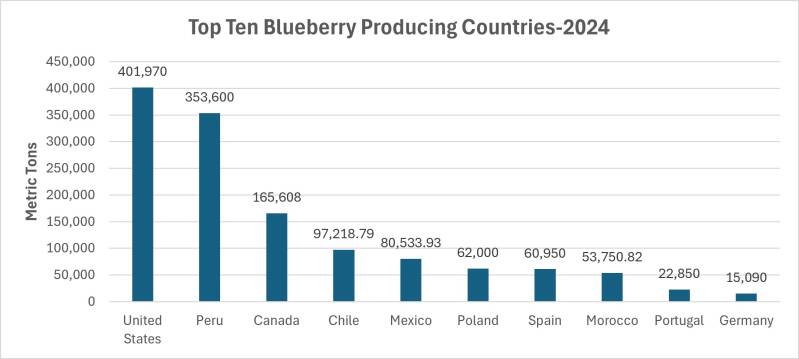
1. Two bar charts displaying national blueberry production in 2024 and 2014 according to FAOSTAT (link)
In 2024, The United States produced nearly 402,000 metric tons of Blueberries and is the leading producer of Blueberries. Canada, one of the U.S. largest Blueberry importers produced roughly three times less Blueberries than the United States. link

In 2014 the United States lead the world in blueberry production, producing a little over 250,000 metric tons of blueberries.
Peru became a dominating blueberry producer over the past 10 years with an absence in 2014 but ranked the second highest producer in 2024. Additionally, The United States has consistently been the top blueberry producer from 2014-2024 according to FAOSTAT. link
2. U.S Total Imports and Exports from 1994-2024 FAOSTAT (link)
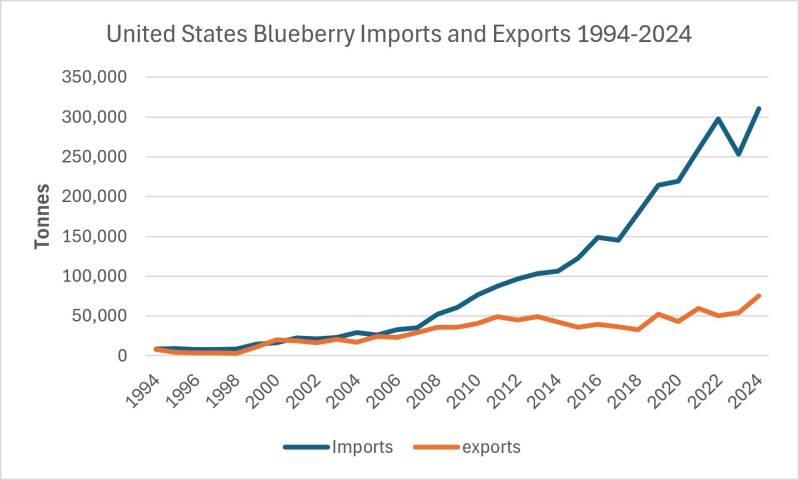
Although the U.S. is the top producer of blueberries, the U.S. imports more blueberries than they export. The American consumers demand blueberries year-round, and blueberries are a seasonal fruit. Therefore, the U.S. is forced to import berries to keep consumers happy throughout the year with ripe fruit.(link)
The graph to the left displays a drastic spike of imports from 2008 to 2022 with a sudden drop from 2022-2024. Determining the primary factor that caused the increase in imports is challenging because the data is categorized by "total blueberry products". This broad classification combines different forms of blueberries, making it hard to distinguish between fresh, frozen, and processed trends. Yet, the drop from 2022-2024 is due to unusual high temperatures in Chile and Peru that harmed blueberry bushes and decreased production. This decreased the amount of blueberries the U.S. could import from other countries. (link)
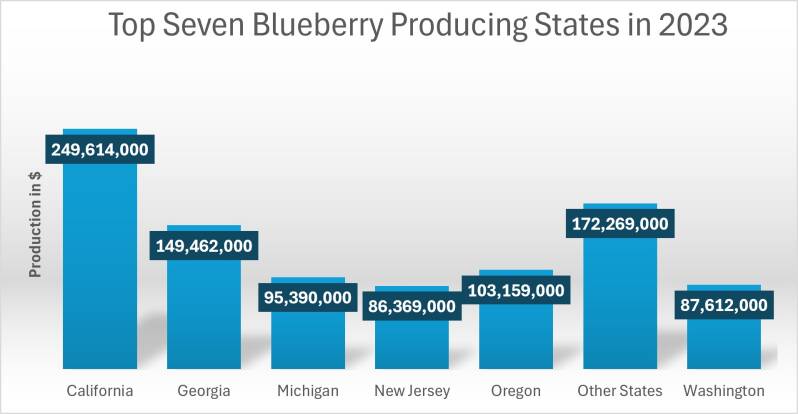
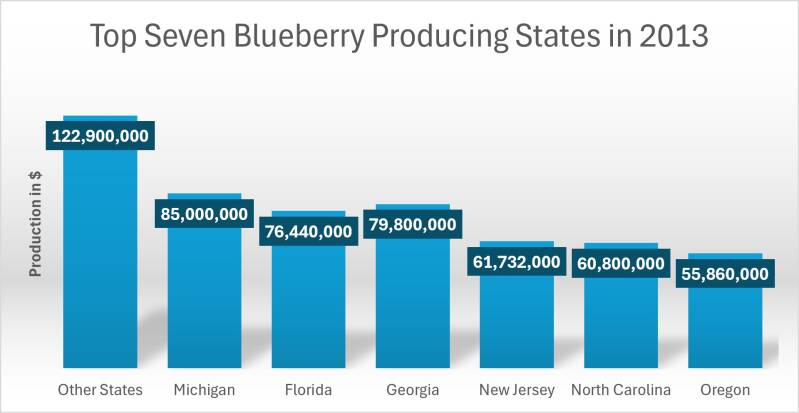
3. Top Ten Blueberry Producing States in the U.S. (link)
In 2023, California led the U.S. in blueberry production value, due to its advanced agricultural technology in the Central Valley and high selling prices. The modern farming and agricultural infrastructure in California demand a higher price per pound than those grown in Georgia. In specific, California sold blueberries for $4.38 per pound in 2023 while Georgia demanded $1.85 per pound. This clearly displays that California sold blueberries for 2 times Georgias price, contributing to California higher production value. (link)(link)
In 2013, "other states" lead production with over $120,000,000 of blueberries produced. This report in specific does not identify "other states", but does provide information on fresh market price at $2.94 per pound. (link)(link)
4. Top Sources of U.S. Blueberry Imports (link)
The image listed below represents the key of types of blueberries included in the pie charts listed below.


The chart listed below explains the partner, product, and value of blueberry imports in 2014, in correlation with the key above.
The chart listed below explains the partner, product, and value of blueberry imports in 2024, in correlation with the key above.

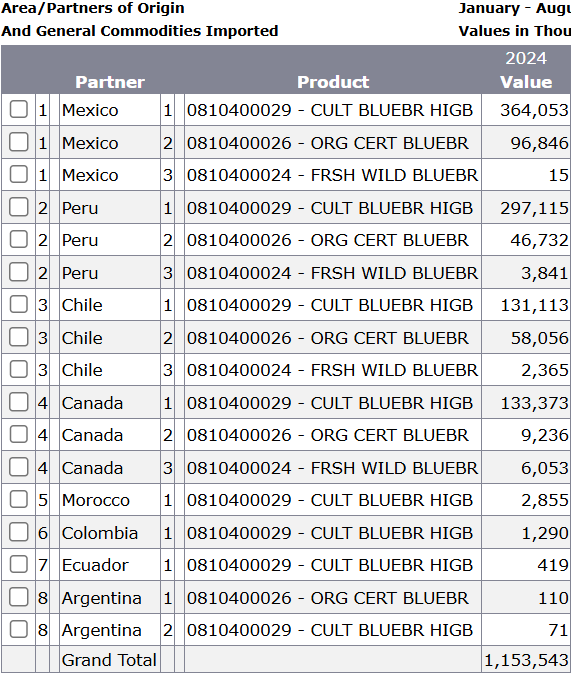


The charts and screenshots clearly show the country of origin, type of berry, and the quantity of berry based on imports in both 2014 and 2024.
5. Top U.S. Blueberry Location Exports (link)
The image listed below represents the key of types of blueberries included in the pie charts listed below.
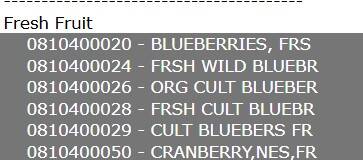
The chart listed below explains the partner, product, and value of blueberry exports in 2014, in correlation with the key above.
The chart listed below explains the partner, product, and value of blueberry exports in 2024, in correlation with the key above.


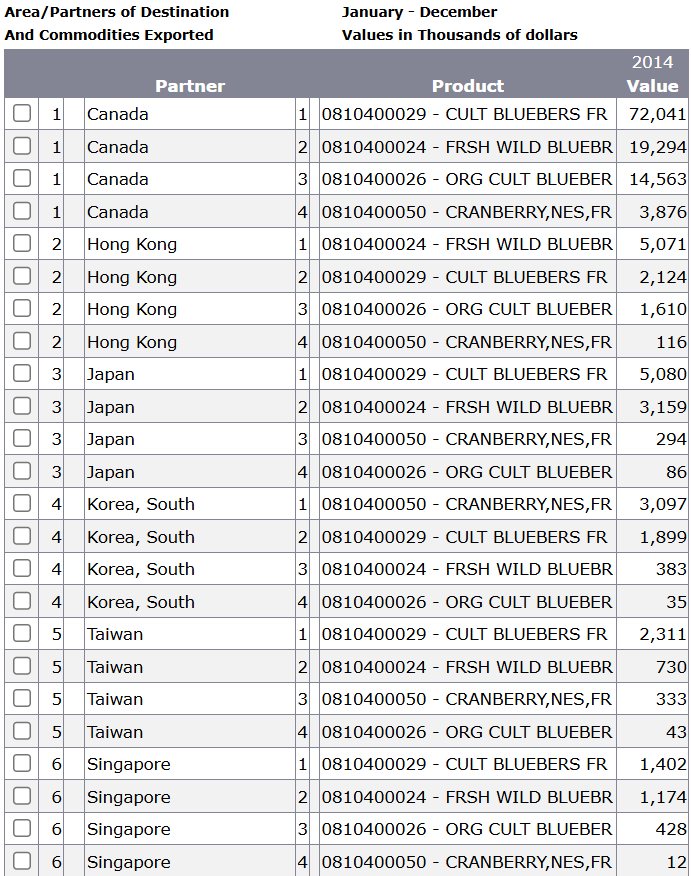
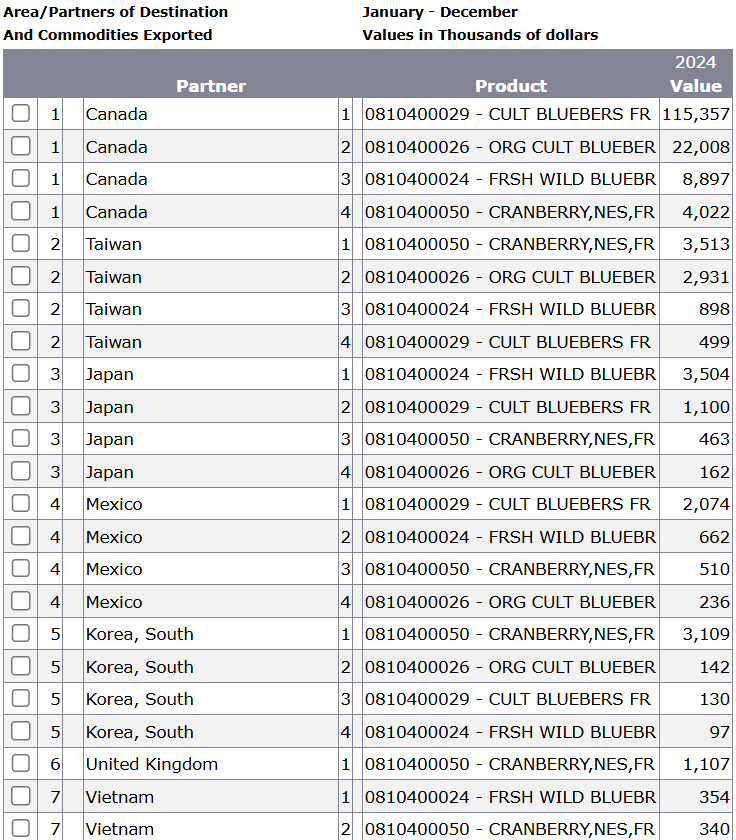
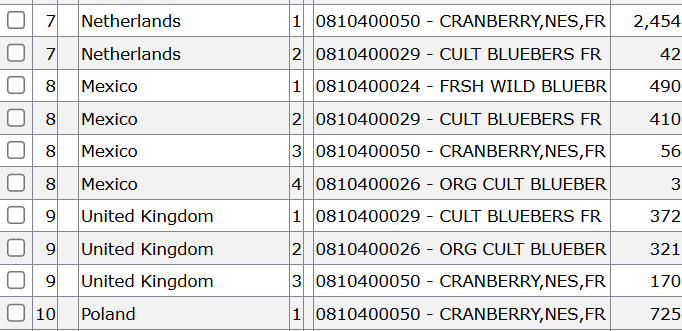
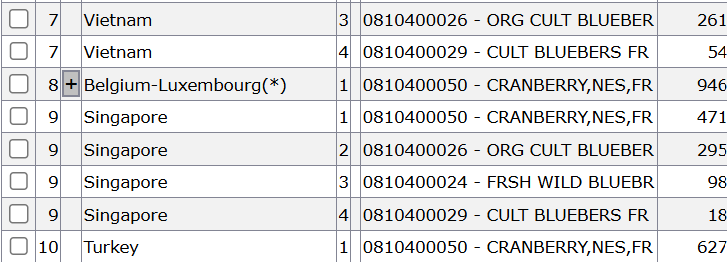
The charts and screenshots clearly show the country of origin, type of berry, and the quantity of berry based on exports in both 2014 and 2024.